Title page Content Tables Figures Acronyms Introduction Indicators Crop Types Aggregation Levels Use Cases Project Partners FAQs Publications Information Desk
|
Indicators Beta Version (January 2017) | ||
|
CAWa/WP3 - Univ. of Wuerzburg (RP for glossary Dr. S. Schönbrodt-Stitt) |
Created: 11.01.2017 10:14:08 |
Updated: 20.01.2017 13:48:05 |
List and Explanations of Land Use and Water-related Indicators Implemented in WUEMoCA
(alphabetical order)
- Crop diversity - Crop rotation - Fallow land frequency - Farm gross actual output - Irrigated acreage per crop -
- Irrigated land use per crop - Major land use - Net irrigated area - Temporary unused irrigable land - Yield -
Information given below on the indicators currently (as of January 2017) implemented into the WUEMoCA tool refers to a set of land use and water related indciators as proposed by the project partner SIC ICWC in Tashkent (Uzbekistan). The set of indciators is supplemented by RS-driven key indicators on the status of land use as proposed by the project partner at the Remote Sensing Unit of the University of Würzburg (Germany).
Generally, those indicators are applied by water and land management organizations, regional and local authorities, and professionals in dealing with routine tasks, analyzing the state of land and water resources in the region and for planning, as well as for drafting reports.
According to the Encyclopedia of Earth (2008) [1], Coops & Bater (2009) [2], and the European Environmental Agency (EEA, 2016) [3], indicators are mainly relevant in:
Basically, indciators are classified as following and help to answer (EEA, 2016):
"In terms of water accounting, the proposed system of indicators helps to have a clearer picture of water distribution in river basins, to enhance ground-based monitoring with RS products, and to improve data accuracy. With this system we can understand where the water goes and where it is used." (written note from 18th May 2017 by Dr. Anatoly Sorokin and Denis Sorokin, both SIC ICWC).
Managers and deputies from water management organizations may use this set of indicators in WUEMoCA for: (i) identifying ways to save water and to improve water productivity, (ii) assessing the effectiveness and equitability of water distribution among users, (iii) identifying additional resources (water sources), including water transfers from one zone to another, (iv) identifying trade-offs for regulation of water withdrawals from transboundary and local sources, and (v) refining pronciples (rules) of distribution to minimize (or avoid) conflicts among users.
Defintions and specifications (Table 3) on the set of indicators as used in the context of WUEMoCA (as of January 2017) are given below. They are listed in alphabetical order. If not stated differentially, definitions of indicators refer to the final report of the .... WUFMAS (Water Use and Farm Management Survey) provided by SIC ICWC. Table 5 gives information for what particular crop type(s) and at which aggregation level(s) indicators implemented are available and can be selected. It is important to note that these indicators are monitored only for the maximum irrigation extent in the ASB (Figure 1) and solely for irrigated crop types in the ASB.
Aggregation levels: Information on indicators is provided at different aggregation levels as shown in Tables 3 and 4. Further information on aggregation levels available in WUEMoCA is given here.
Temporal scales: Information on indicators is provided at two different temporal scales (Table 3). For annual indicators information is given for one selected year out of the total observation period. Information given for multi-annual indicators refers to the total observation period starting from the year 2000 on. Thus, for multi-annual indicators the sum of observations from all years is averaged by the number of years in the total observation period.
--> Agricultural diversity OR Irrigated cropland diversity
- Annual information on the variety of different crop types -
In the context of WUEMoCA, the indicator 'Crop diversity' (CD) is defined as the variety of different crop types per year (annual indicaator) within a certain aggegration level. CD is calculated according the Simpson Index of Diversity (SID) [Simpson, 1949].
The irrigated cropland diversity is calculated according to the Inverse Simpson's Diversity Index using following equation:
D' = 1 - SUM pi² with pi = ni_{crop} / N
Where: D' = diversity index (dimensionless) per aggregation unit, pi = Diversity variable per aggregation unit, N = total number of individuals (referring to irrigated cropland pixels) within one aggregation unit of the regular raster, and ni = total number of individuals (referring to irrigated cropland pixels) per crop type within one aggregation unit of the regular raster. {crop} is the crop type to be considered.
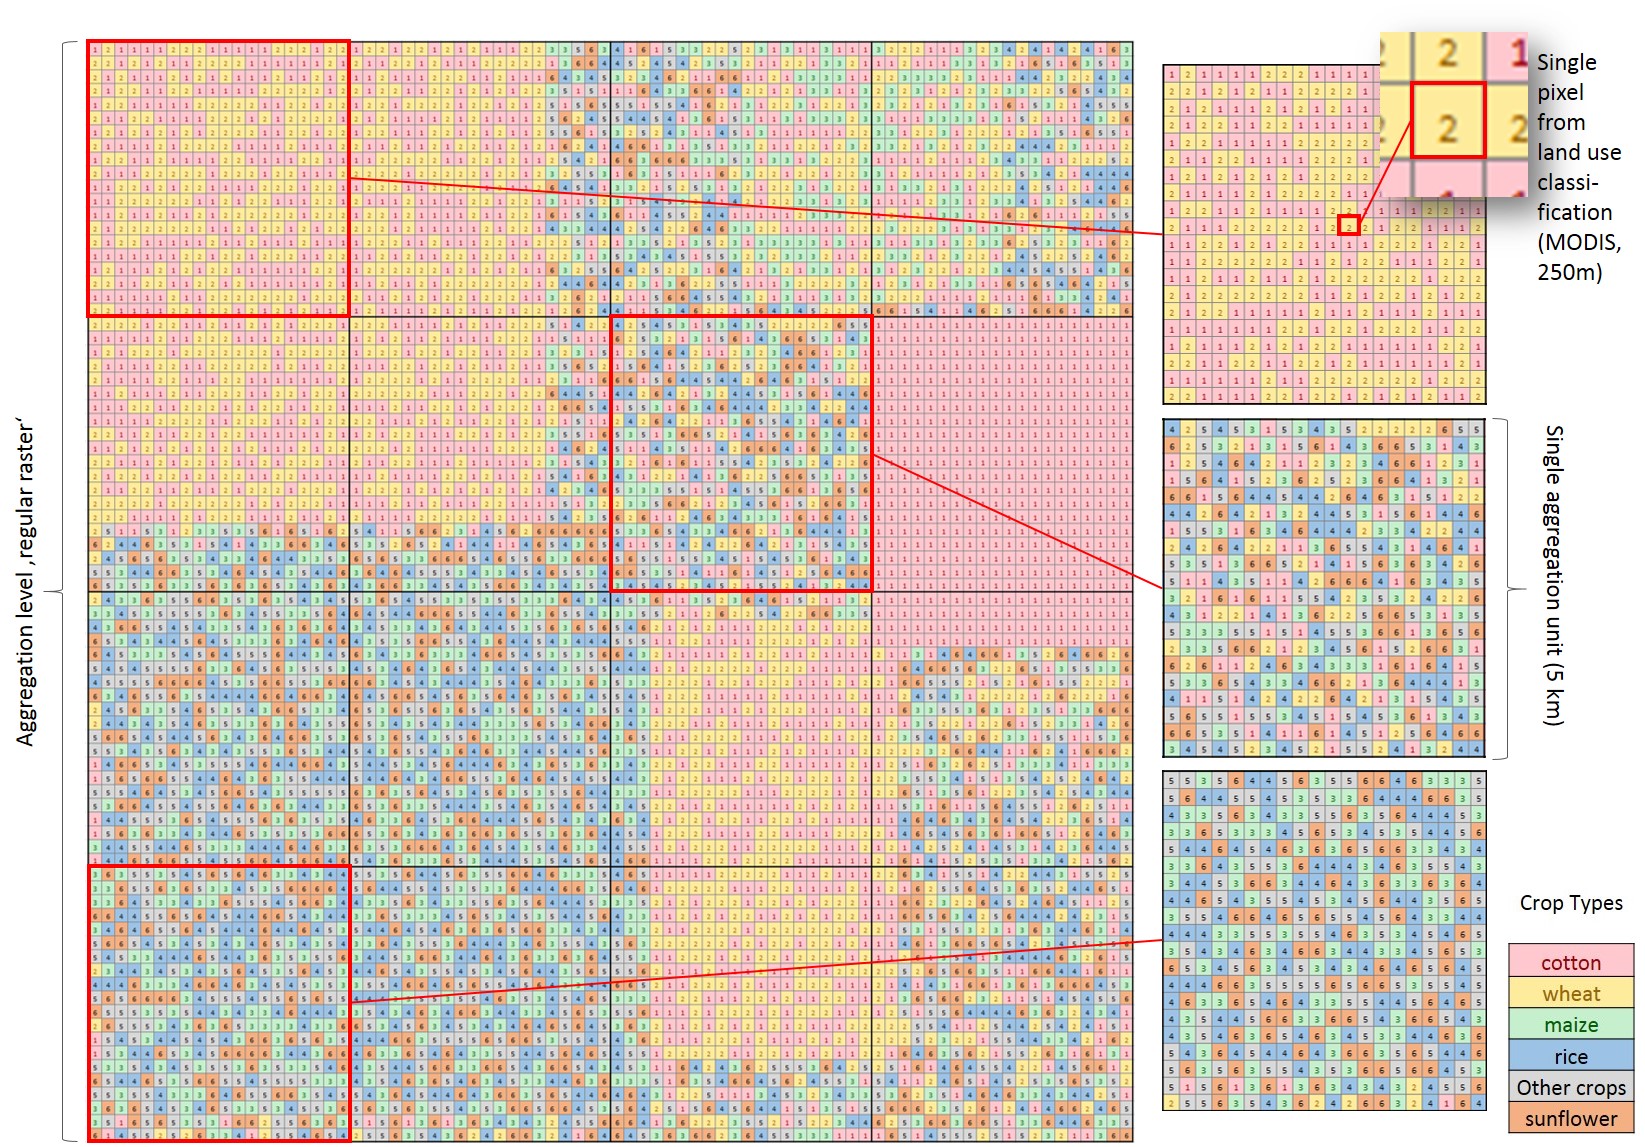
A schematic illustration on database and calculation of the diversity index is given in Figures 1 and 2.
Figure 1. Schematic illustration on the GIS-based calculation of the crop diversity at the aggregation level of a regular raster. Each regular raster comprises aggregation units with a pixel cell size of 5 km x 5 km. Annual information on the variety of crop types is based on land use classifciation based on MODIS data. Each single MODIS pixel (cell size of 250 m x 250 m) is assigned to a certain crop type. The diversity index is calculated for all crop type pixels in one aggregation unit for the entire regular raster. Please note that this is a synthetic example meaning that the crop types (land uses) chosen are fictive in order to visualize the procedure of calculation.
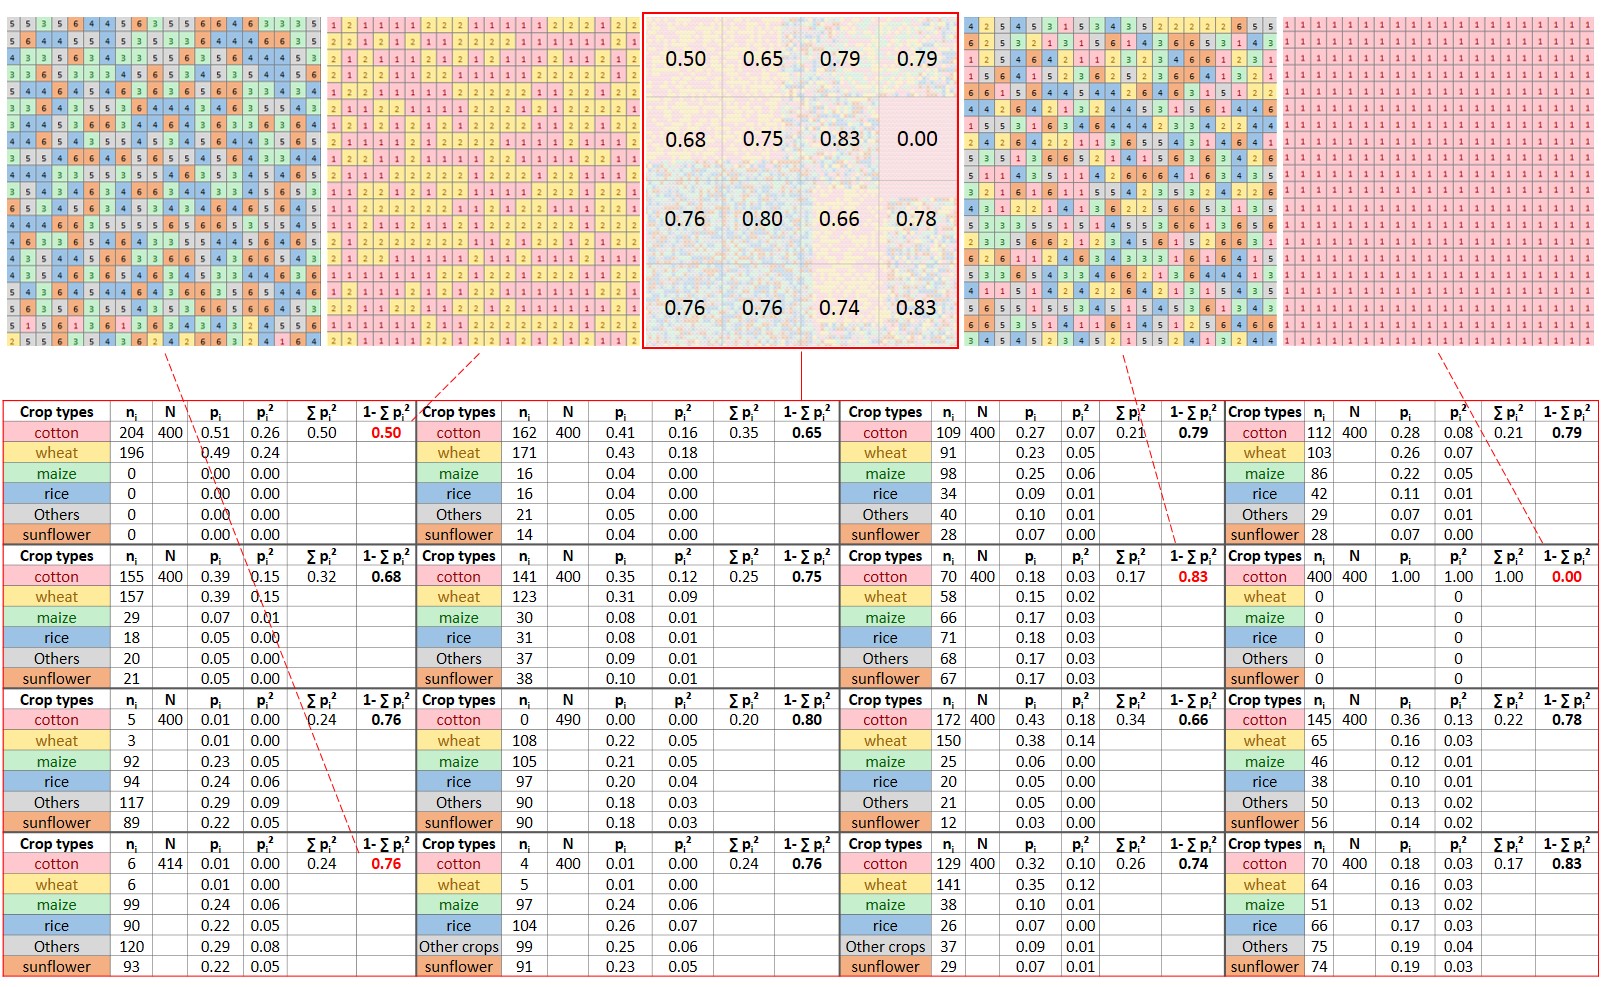
Figure 2. Schematic illustration on the exemplary calculation of the crop diversity based on teh above regular raster and MODIS land use classification according to the Inverse Simpson's Diversity Index. Please note that this is a synthetic example meaning that the crop types (land uses) chosen are fictive in order to visualize the procedure of calculation. In this example, the diversity index has been calculated in excel for the reason of demonstration. Results on the diversity index in WUEMoCA are based on GIS analysis.
The annual crop diversity indicator is based on variety of different crops within an aggregation unit. This calculation can be taken to further produce maps by deploying the Simpson Index of Diversity (SID). SID marks one of the oldest means for the assessment of diversity, first presented in 1949. It has since been commonly used in diversity studies. Originally used in biology, it displays diversity as the simple concept of the chance to draw from a population two individuals of the same species. It ranges from 1 to 1/z, where z is the number of species present in the area (Simpson, 1949). In the case of this case study, z equals the number of the different crops. For this purpose, the extended version of the index is calculated by subtracting the value from its maximum of 1 using Equation 21 according to Peet (1974):
- Multi-annual information on the alternation of different crop types -
Generally, the indicator 'Crop rotation' (CR) is defined as the practice of growing a sequence of crops on a particular field through time [4, 5, 6]. CR is one of the oldest and most essential agronomical practice in a crop growing systems aiming at preserving soil quality [5,7]. Thus, CR enables for the identification of long-term spatial patterns of crop cultivation. Basically, CR can be calculated in two different ways that address two relevant questions in land use analysis. These are: (i) How many different crops have been cultivated on a certain spot (represented by a pixel) for a period of interest? and (ii) how often has the cultivation of crops on a certain spot (represented by a pixel) changed for a period of interest?
First question can be answered by considering CR defined as the multi-annual number of different crop types over time. Therefore, the GIS-based calculation of CR in WUEMoCA considers the different single rasterized land use maps (MODIS) starting from 2000 and ending in 20xx (xx indicates final year of observation) and counts how many different crop types were assigned to a certain pixel in the crop type maps (here synonym to land use maps).
Table 1 gives an example on CR defined as the number of different crop types. According to this example, the one pixel has been occupied by two different crop types (i.e., cotton and wheat) within five years, Thus the CR value is 2. Figure 3 exemplarily shows the number of different crop types per pixel for a data array of rasterized land use maps for the observation period from 2000 to 2016. The resulting CR values (framed) ranging between 2 and 4 thus indicate that the individual pixels have been cultivated with 2 to 4 different crops within the period of 17 years. Generally, the higher the CR value per pixel, the more different crop types have been cultivated over time. By considering rasterized CR maps, conclusions on the cropping pattern over time can be drawn (e.g., regions of mono-cropping or regions characterized by a sequence of dissimilar crop types grown).
Table 1. Example on the calculation of crop rotation (CR) defined as the number of different crop types for one pixel and for a short observation period of five years.
| Pixel in year |
2011 |
2012 |
2013 |
2014 |
2015 |
CR - Number of different crop types for this pixel from 2011 to 2015 |
| Crop type |
cotton |
wheat |
cotton |
wheat |
wheat |
2 |
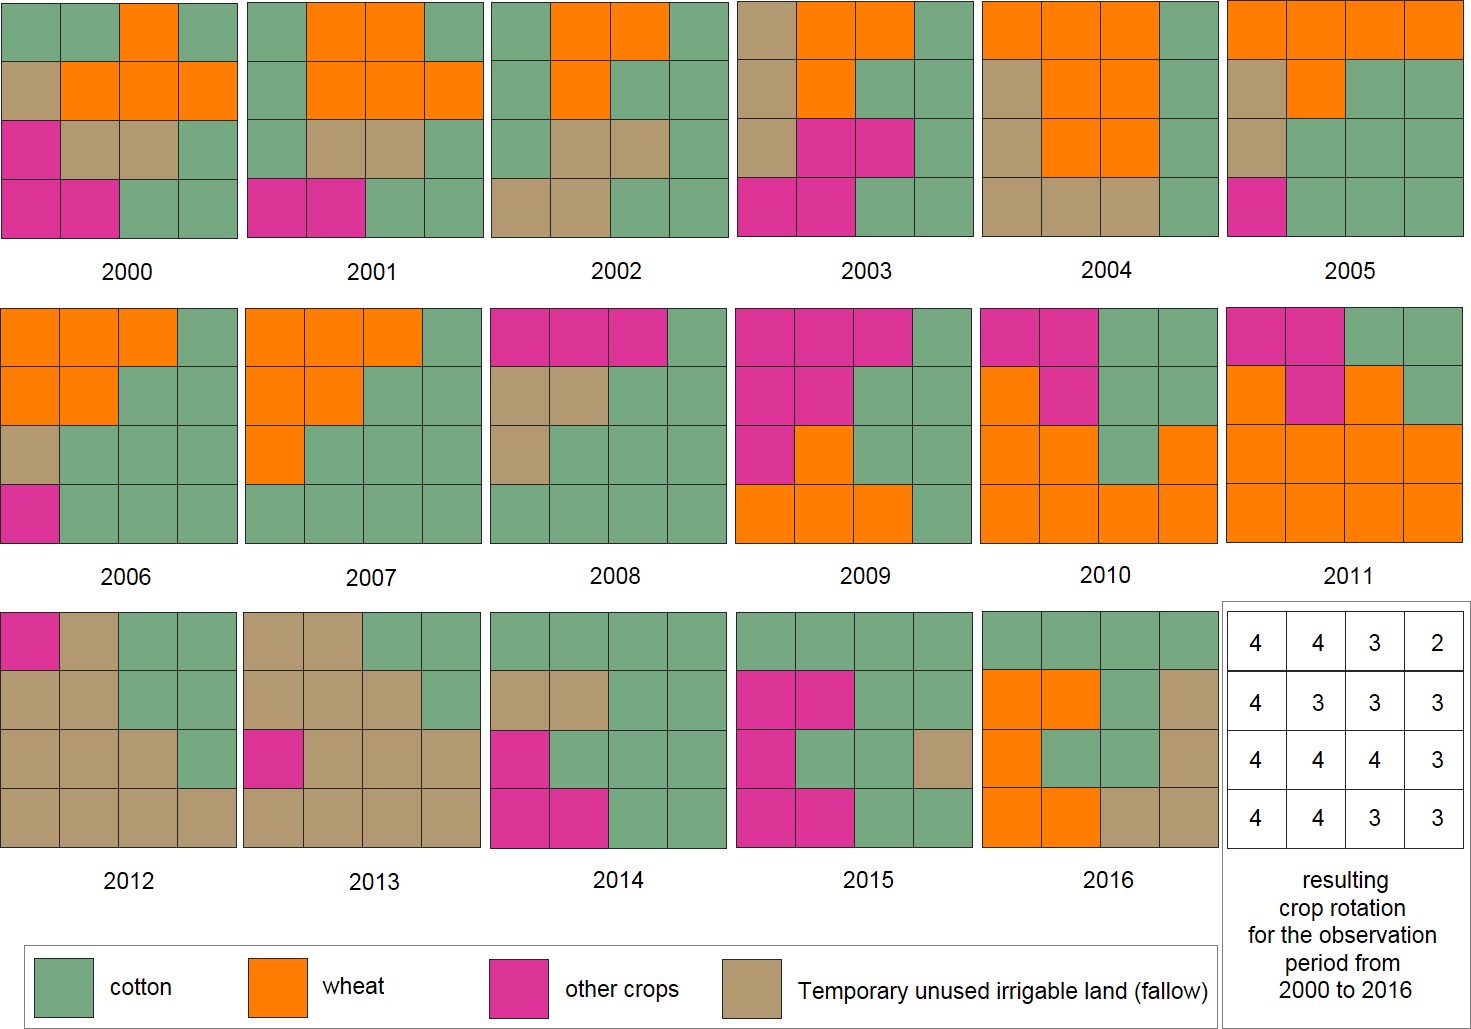
Figure 3. Schematic illustration of the GIS-based raster calculation of the 'Crop rotation' CR (framed), here defined as the number of different crop types over time, for a data array of single rasterized land use maps for the years from 2000 to 2016. The different colors indicate the crop types assigned to the according pixels in the raster layer. Please note that this is a synthetic example meaning that the crop types (land uses) chosen are fictive in order to visualize the procedure of calculation.
Second question can be answered by considering CR defined as the number of changes of crop types over time. Therefore, the GIS-based calculation of CR considers the different single rasterized land use maps (MODIS) starting from 2000 and ending in 20xx (xx indicates final year of observation) and counts how often the cultivation of crop types assigned to a certain pixel has been changed.
Using the same examples as displayed above, Table 2 and Figure 4 now show the resulting CR value(s) per pixel(s). As exemplarily shown, cultivation of crops has changed three times within five years, resulting in a CR value of 3. As exemplarily shown in the resulting raster map of CR (Figure 4), higher values of CR (framed) indicate a more frequent alternation of crop types within the period of 17 years. Mono-cropping regions with no or less rotation will be indicated by lower values of CR.
Table 2. Example on the calculation of crop rotation (CR) defined as the number of changes of crop types for one pixel and for a short observation period of five years.
|
Pixel in year |
2011 |
2012 |
2013 |
2014 |
2015 |
CR - Number of changes of crop types for this pixel from 2011 to 2015 |
| Crop type |
cotton |
wheat |
cotton |
wheat |
wheat |
3 |
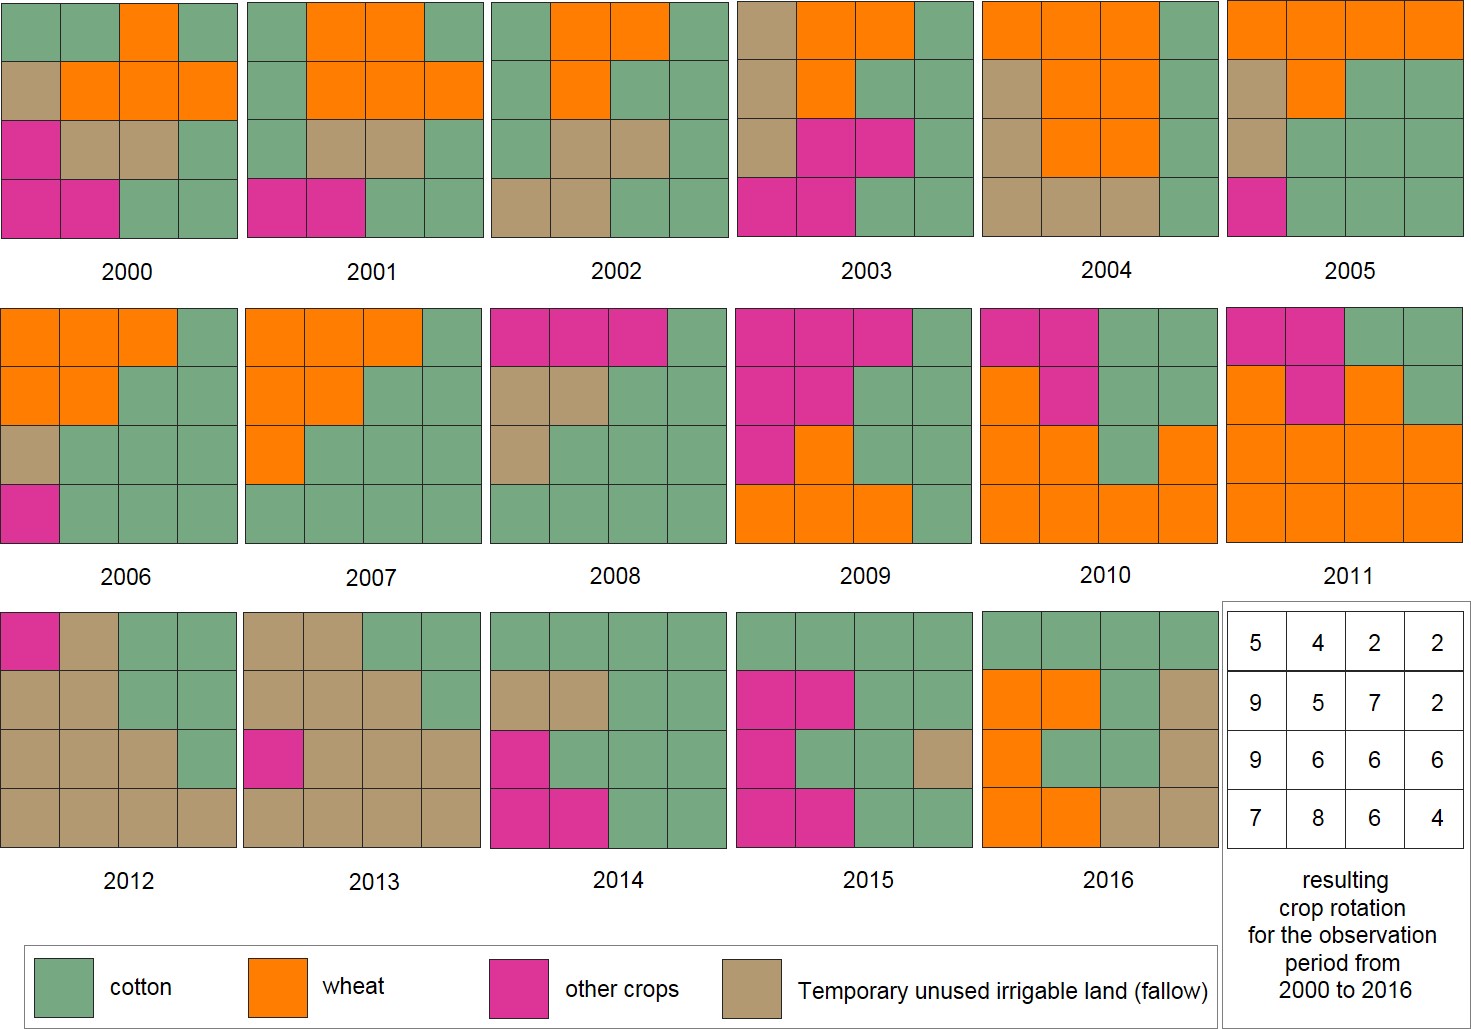
Figure 4. Schematic illustration of the GIS-based raster calculation of the indicator 'Crop rotation' CR (framed), here defined as the number of changes of crop types over time, for a data array of single rasterized crop type maps for the years from 2000 to 2016. The different colors indicate the crop types assigned to the according pixels in the raster layer within the observation period. Please note that this is a synthetic example, meaning that the crop types displayed are fictive in order to visualize the procedure of calculation.
In the beta version of WUEMoCA, information on CR is considered as the multi-annual number of different crop types per pixel over time only. Also, CR is calculated for the whole range of years available in the entire observation period (2000 - 2016). CR is only provided as regular raster at the level of countries, provinces, and districts (where irrigated cropland is available only).
- Averaged multi-annual information on the number of years for which land was set aside before recultivation -
- Annual information on the crop quantities produced -
Farm gross output actual (Pir_f) is defined as the actual output, respectively crop quantity produced, for a given crop {crop} within a certain level of aggregation (Tables 3 and 4). Generally, Pir_f can be derived as a statistical indicator (statistical analysis of primary field data) or by means of RS. In WUEMoCA, Pir_f is derived from RS data. Metric unit is tons (t).
In the current version of WUEMoCA, Pir_f is assessed for the irrigated crop types cotton and wheat only. Pir_f is an annual indicator, thus information on farm gross output actual in WUEMoCA is available for each single year in the total observation period starting from the year 2000 on. Please note: In the current beta version of WUEMoCA, farm gross output actual data is not available for the year 2016. Farm gross output actual data is provided for all aggregation levels considered in WUEMoCA.
- Annual information on the cropped area under irrigation -
- Annual information on the cropping intensity on actually irrigated areas -
The indicator on irrigated land use per crop (Uir) is defined as actual area share of a certain crop type {crop} .... refers to cropping intensity. Values in WUEMoCA can range from 0 to 200 %
Uir_{crop} = [Fir_f_{crop} / Fir_n] x 100
where: Uir_{crop} = irrigated land use for a certain crop (%), Fir_f_{crop} = irrigated acreage per certain crop (ha), and Fir_n = net irrigated area (ha). {crop} is the crop type of interest that is to be selected.
In WUEMoCA, Uir is available for each single crop type/land use type assessed and monitored (i.e., all crops, cotton, maize, other crops, rice, sunflower, urban garden, vegetable, and wheat).
Uir is an annual indicator. Thus, information on the irrigated land use per crop in WUEMoCA is available for each single year in the total observation period starting from the year 2000 on. Uir is provided for all aggregation levels considered in WUEMoCA.
Values of Uir in WUEMoCA range between 0 % to 200%.
In the maps shown in the web interface (window center), information on Y is provided as relative values. Thus, presentation of Y values is given as colored maps ranging from yellow for low yields to orange color for medium yields to light and dark green for high, respectively, highest yields. Explanation on the color ramp is given in the legend. Absolute values on Y can be accessed via database query when mouse clicking on the provided area (given as polygon) of interest in the web interface (window center), and exporting indicator values to excel or as a chart (PNG). Via uploading and/or drawing further polygons (function My Polygons), representing any desired further aggregation unit, absolute values on yield for cotton and wheat can be also calculated and exported.
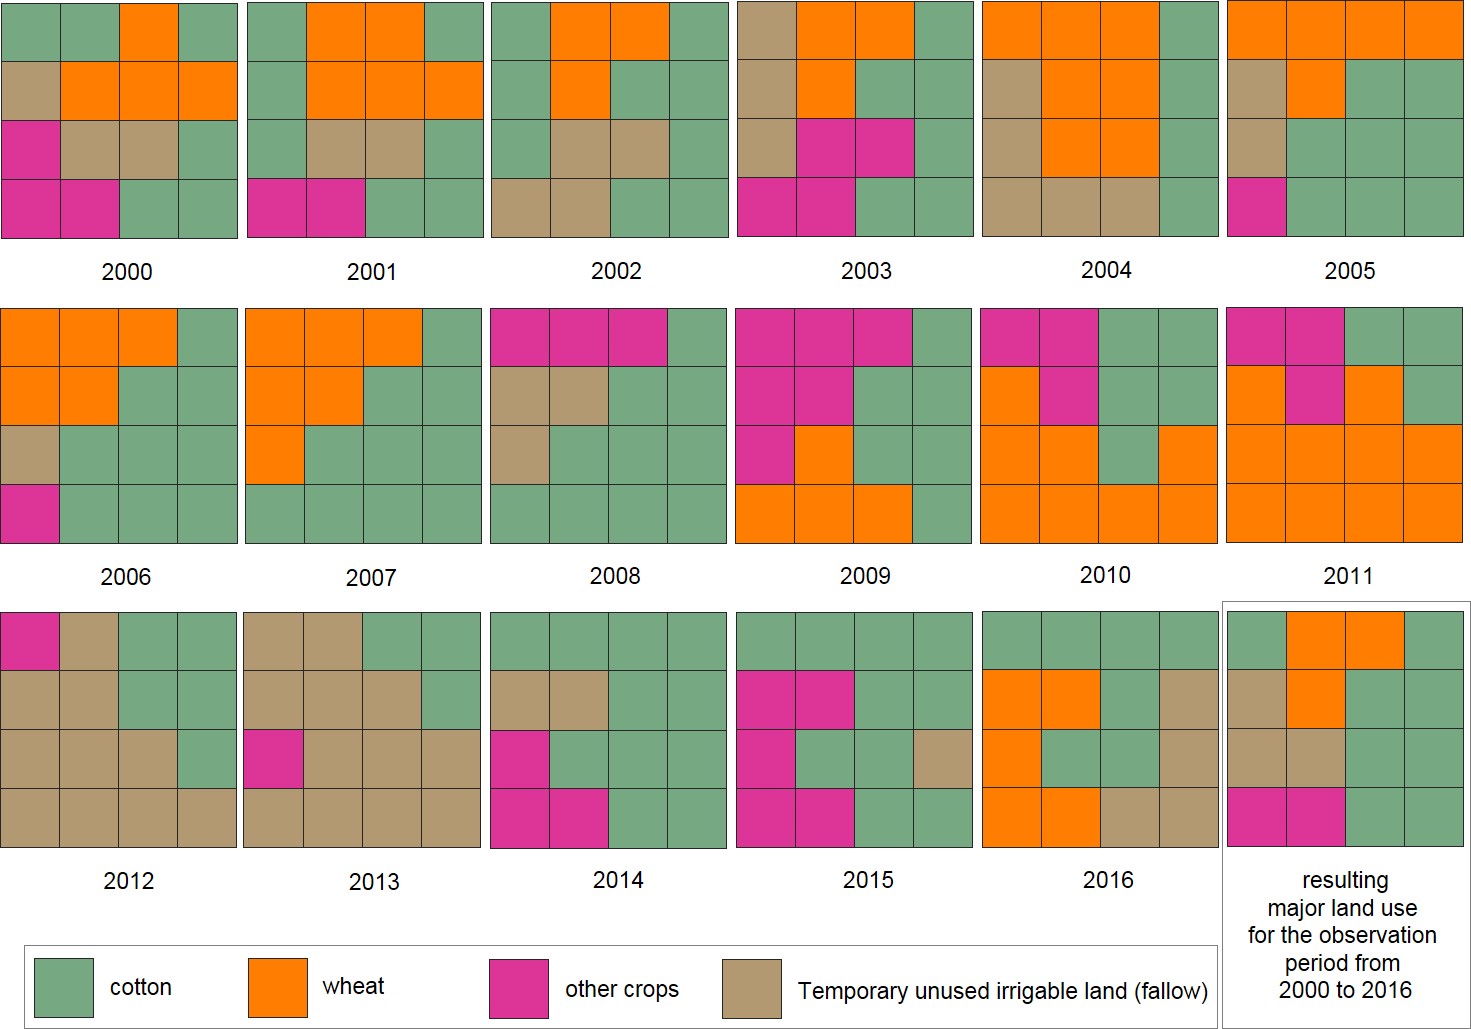
- Multi-annual information on the predominating
land use - Major land use (MLu) is defined as the predominating land
use for the entire period of observation (multi-annual information) starting
from the year 2000 and ending in 20xx (xx indicates final year
of observation). In the beta version of WUEMoCA, MLu is
calculated for the whole range of years available in the entire observation
period (2000 - 2016). MLu is based on the calculation of the
majority value for each pixel in the rasterized land use maps (based
on MODIS). It indicates pixel-per-pixel that land use type, which occurs
most often within the considered range of time. The calculation of MLu
is GIS-based meaning that all land use maps for the single years are
considered. In statistics, the majority value (i.e., major land use) is
often called mode value. The mode value of a layer stack (i.e., all
rasterized land use maps to be considered for the calculation of MLu)
is that element (i.e., land use type), which has the greatest frequency at the
specific pixel. Figure 5 shows an
illustration for the GIS-based calculation of MLU based on single
rasterized land use maps from 2000 to 2016. The result (framed) is not
a numeric value but the predominating land use (integer value). The indicator
MLu thus aims at the spatial identification of predominant land
use types (i.e., crop types, cropping systems in a certain area of interest
(i.e., aggregation level). MLu therefore eases interpretation of land
use patterns such as mono-cropping, absence of crop rotations or successful
cultivation of a certain crop type. An
important limitation of this indicator is that if a majority value (i.e., major
land use) cannot be identified because two or more crop types occur
equally throughout time, the pixel value will become blank, thus identifying no
MLu for the according pixel. To overcome this limitation, the threshold
of majority in GIS-based analysis can be increased, for instance from 50%
(default) to at least 60%, having a higher majority vote for the analysis
layer. Calculated MLu in the beta version of the WUEMoCA tool is based
on a threshold of majority of 50%. In the beta version
of WUEMoCA, information on MLu (2000 - 2016) is only provided
as regular raster at the level of countries,
provinces, and districts (where irrigated cropland is available
only). Figure 5. Schematic
illustration of the GIS-based raster calculation of the indicator
'Major land use' MLu (framed) for a data array of single rasterized crop type
maps for the years from 2000 to 2016. The different colors indicate the crop
types assigned to the according pixels in the raster layers within the period of
observation. Please note that this is a synthetic example, meaning that the crop
types displayed are fictive in order to visualize the procedure of
calculation. -
Averaged multi-annual information on the area equipped with irrigation
infrastructure -
Temporary unused irrigable land
- Annual information on the area share of land that was set aside
before recultivation to the net irrigated area -
- Annual
information on the harvested production per unit of harvested area -
Yield (Y) is defined as the
actual volume, respectively, actual quantity of crop output (farm gross
output actual) received from 1 ha of irrigated cropland area. Metric unit is
tons per hectare (t/ha). Generally, Y can be derived as a statistical
indicator or by means of RS. In WUEMoCA, Y is derived from RS. It is
calculated as following: Y_{crop} = Pir_f_{crop} /
Fir_f_{crop} Where: Y_{crop} = yield for a
certain crop (t/ha), Pirf_f_{crop} = farm gross output actual for a
certain crop (t), and Fir_f_{crop} = irrigated acreage per this certain
crop (ha). {crop} is the crop type of
interest that is to be selected. In the current version of WUEMoCA, Y is assessed for the irrigated
crop types cotton and wheat only. Y is an annual indicator, thus
information on yield in WUEMoCA is available
for each single year in the total observation period starting from 2000.
[Please note: In the current beta version of WUEMoCA, yield data is not
available for the year 2016.] Yield data is provided for all aggregation levels considered in WUEMoCA. In the maps shown in the web
interface (window center), information on Y is provided as
relative values. Thus, presentation of Y values is given as colored
maps ranging from yellow for low yields to orange color for medium
yields to light and dark green for high, respectively, highest yields.
Explanation on the color ramp is given in the legend. Absolute values
on Y can be accessed via database query when mouse clicking on the
provided area (given as polygon) of interest in the web interface (window
center), and exporting indicator values to excel or as a chart (PNG). Via
uploading and/or drawing further polygons (function My Polygons),
representing any desired further aggregation unit, absolute values on yield for
cotton and wheat can be also calculated and exported.
Table 3. Specifications of indicators implemented in the online information tool WUEMoCA.
| Name of indicator |
Acronym in database |
Acronym in documentation |
Unit |
Aggregation level |
Temporal scale |
| Crop diversity |
cd |
CD |
dimensionless; (-) |
Regular raster |
annual |
| Crop rotation |
cr |
CR |
dimensionless; (-) |
Regular raster |
multi-annual |
| Fallow land frequency |
flf |
FLF |
dimensionless; (-) |
Regular raster |
multi-annual |
| Farm gross output actual |
pirf_{crop} |
Pir_f |
tons; (t) |
Province, district, BISA, ISA, WUA, channel command area, regular raster |
annual |
| Irrigated acreage per crop |
firf_{crop} |
Fir_f |
hectare; (ha) |
Province, district, BISA, ISA, WUA, channel command area, regular raster |
annual |
| Irrigated land use per crop |
uir_{crop} |
Uir |
percentage; (%) |
Province, district, BISA, ISA, WUA, channel command area, regular raster |
annual |
| Major land use |
mlu |
MLu |
dimensionless; (-) |
Province, district, BISA, ISA, WUA, channel command area, regular raster |
multi-annual |
| Net irrigated area |
fir_n |
Fir_n |
hectare; (ha) |
Province, district, BISA, ISA, WUA, channel command area, regular raster |
multi-annual |
| Temporary unused irrigable land |
fp |
FP |
percentage; (%) |
Province, district, BISA, ISA, WUA, channel command area, regular raster |
annual |
| Yield |
y_{crop} |
Y |
tons per hectare; (t/ha) |
Province, district, BISA, ISA, WUA, channel command area, regular raster |
annual |
Table 4. Map selection matrix on indicators implemented in WUEMoCA (alphabetical order).
Explanation: ● = information available, thus selectable, ○ = information not available, thus not selectable. (As of 09 January 2017).
| Name of indicator | Crop types | Aggregation levels | |||||||||||||||
|
Other crops |
|||||||||||||||||
| Crop diversity |
○ |
○ |
○ |
○ |
○ |
○ |
○ |
○ |
○ |
○ |
○ |
○ |
○ |
○ |
○ |
○ |
● |
| Crop rotation |
○ |
○ |
○ |
○ |
○ |
○ |
○ |
○ |
○ |
○ |
○ |
○ |
○ |
○ |
○ |
○ |
● |
| Fallow land frequency |
○ |
○ |
○ |
○ |
○ |
○ |
○ |
○ |
○ |
○ |
○ |
○ |
○ |
○ |
○ |
○ |
● |
| Farm gross output actual |
○ |
● |
○ |
○ |
○ |
○ |
○ |
○ |
○ |
● |
● |
● |
● |
● |
● |
● |
● |
| Irrigated acreage per crop |
● |
● |
● |
● |
● |
● |
● |
● |
● |
● |
● |
● |
● |
● |
● |
● |
● |
| Irrigated land use per crop |
● |
● |
● |
● |
● |
● |
● |
● |
● |
● |
● |
● |
● |
● |
● |
● |
● |
| Major land use |
○ |
○ |
○ |
○ |
○ |
○ |
○ |
○ |
○ |
○ |
○ |
○ |
○ |
○ |
○ |
○ |
● |
| Net irrigated area |
○ |
○ |
○ |
○ |
○ |
○ |
○ |
○ |
○ |
○ |
● |
● |
● |
● |
● |
● |
● |
| Temporary unused irrigable land |
○ |
○ |
○ |
○ |
○ |
○ |
○ |
○ |
○ |
○ |
● |
● |
● |
● |
● |
● |
● |
| Yield |
○ |
● |
○ |
○ |
○ |
○ |
○ |
○ |
○ |
● |
● |
● |
● |
● |
● |
● |
● |
References
[1] The Encyclopedia of Earth (2008). Environmental indciators. Accessed at http://www.eoearth.org (2016-05-03)
[2] Coops, N.C., Bater, C.W. (2009). Remote sensing opportunities for monitoring indicators of forest sustainability. FREP Report '21, Forest and Range Evaluation Program. Department of Forest Resources Management, University of British Columbia, Vancouver, pp. 53. Accessed at https://www.for.gov.bc.ca (2016-07-21)
[3] European Environmental Agency (2016). Environmental terminology and discovery service (ETDS). Accessed at http://glossary.eea.europa.eu (2016-05-03)
[4] Wibberley, J. (1996). A brief history of rotations, economic considerations and future directions. Aspects of Applied Biology 47: 1-10.
[5] Castellazzi, M.S., Wood, G.A., Burgess, P.J., Morris, J., Conrad, K.F., Perry, J.N. (2008). A systematic representation of crop rotations. Agricultural Systems 97: 26-33. DOI: 10.1016/j.agsy.2007.10.006
[6] Dury, J., Schaller, N., Garcia, F., Reynaud, A., Bergez, J.E. (2012). Models to support cropping plan and crop rotation decisions. A review. Agronomy for Sustainable Development. 32: 567-580. DOI: 10.1007/s13593-011-0037-x
[7] Capitanescu, F., Marvuglia, A., Navarrete Gutiérrez, T., Benetto, E. (2017). Multi-stage farm management optimization under environmental and crop rotation constraints. Journal of Cleaner Production. http://dx.doi.org/10.1016/j.jclepro.2017.01.076